Ever wondered how scientists know that 9 out of 10 dentists really do recommend that toothpaste? Or how marketers determine which ad will get more clicks? The answer is quantitative research. This powerful approach turns information into numbers you can measure and analyze.
What is Quantitative Research?
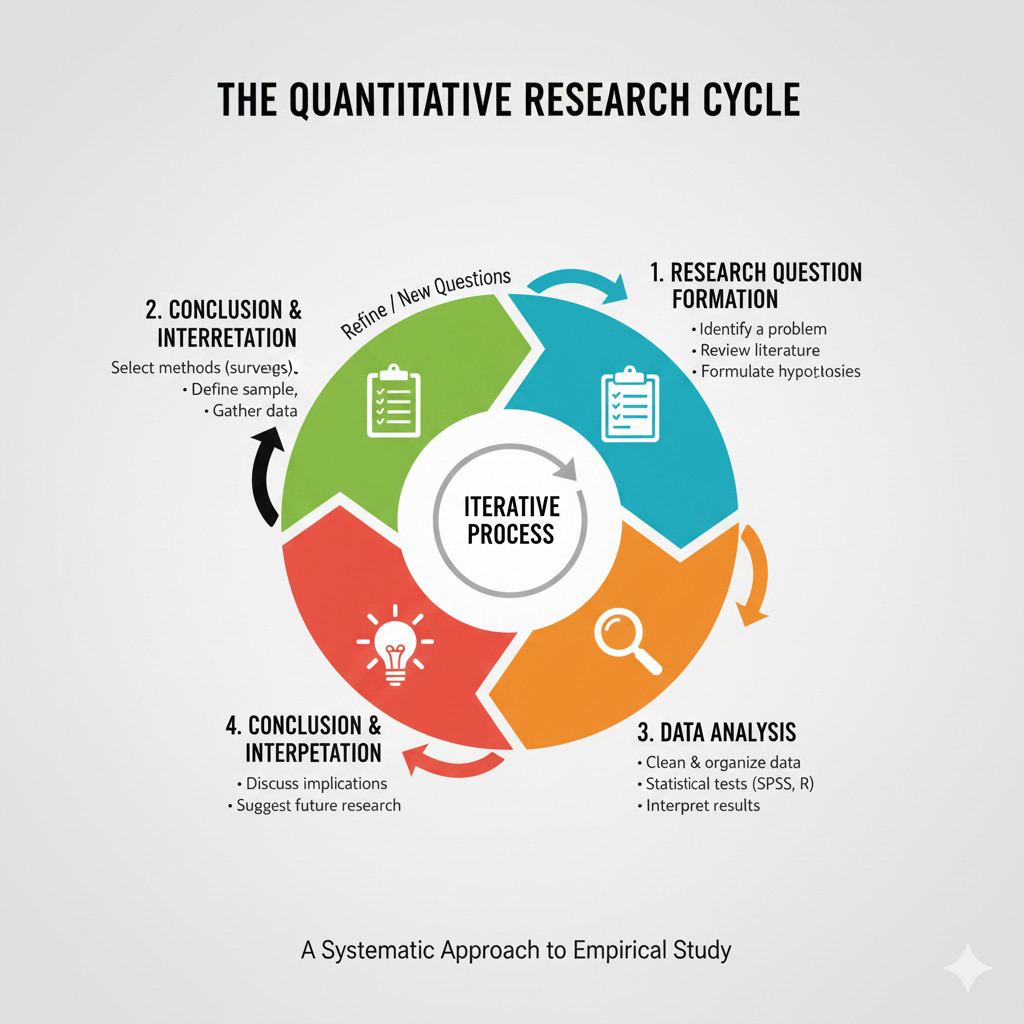
Quantitative research is a systematic method of collecting and analyzing numerical data. It’s all about measuring things in numbers and statistics to find patterns and make predictions.
Unlike qualitative research that explores feelings and experiences, quantitative research focuses on hard facts and figures.
Think of it as the difference between asking “How satisfied are you with our service on a scale of 1-10?” versus “Tell me about your experience with our service.”
The first question gives you a number you can measure. The second gives you insights that are harder to count.
Businesses, scientists, and researchers use quantitative methods when they need clear, objective data to make decisions.
Characteristics of Quantitative Research
What makes research truly quantitative? Look for these key features:
Measurable Variables
Everything studied can be counted or measured numerically. Whether it’s temperature, test scores, or customer ratings, quantitative research deals with things you can assign a number to.
Large Sample Sizes
Quantitative studies typically involve many participants. The larger your sample, the more confident you can be that your findings represent the whole population.
Structured Approach
Research follows a pre-planned, organized process. You decide exactly what to measure before starting your study.
Objective Data
Results are based on numbers, not opinions or feelings. This reduces researcher bias and increases reliability.
Statistical Analysis
Data is examined using mathematical methods to find patterns, relationships, and significant differences.
Generalizable Results
Findings from a properly selected sample can be applied to larger populations.
![Image suggestion: Visual showing the key characteristics with simple icons representing each point]
Quantitative Research Methods
Ready to collect some data? Here are the main approaches to quantitative research:
Primary Quantitative Research Methods
These methods involve collecting fresh, original data directly from participants:
1. Survey Research
The most common method where researchers ask standardized questions to collect data from participants. Think customer satisfaction surveys or political polls.
Types of surveys include:
- Cross-sectional surveys: Collect data at one specific point in time (like a snapshot)
- Longitudinal surveys: Track changes by collecting data from the same group multiple times
2. Correlational Research
Examines relationships between variables without manipulating them. For example, studying whether there’s a connection between hours spent exercising and blood pressure levels.
3. Causal-Comparative Research
Compares groups that differ on a key variable to see if this difference causes variations in another variable. For instance, comparing test scores between students who received different teaching methods.
4. Experimental Research
The gold standard for establishing cause-and-effect relationships. Researchers manipulate one variable (independent) to see its effect on another (dependent) while controlling all other factors.
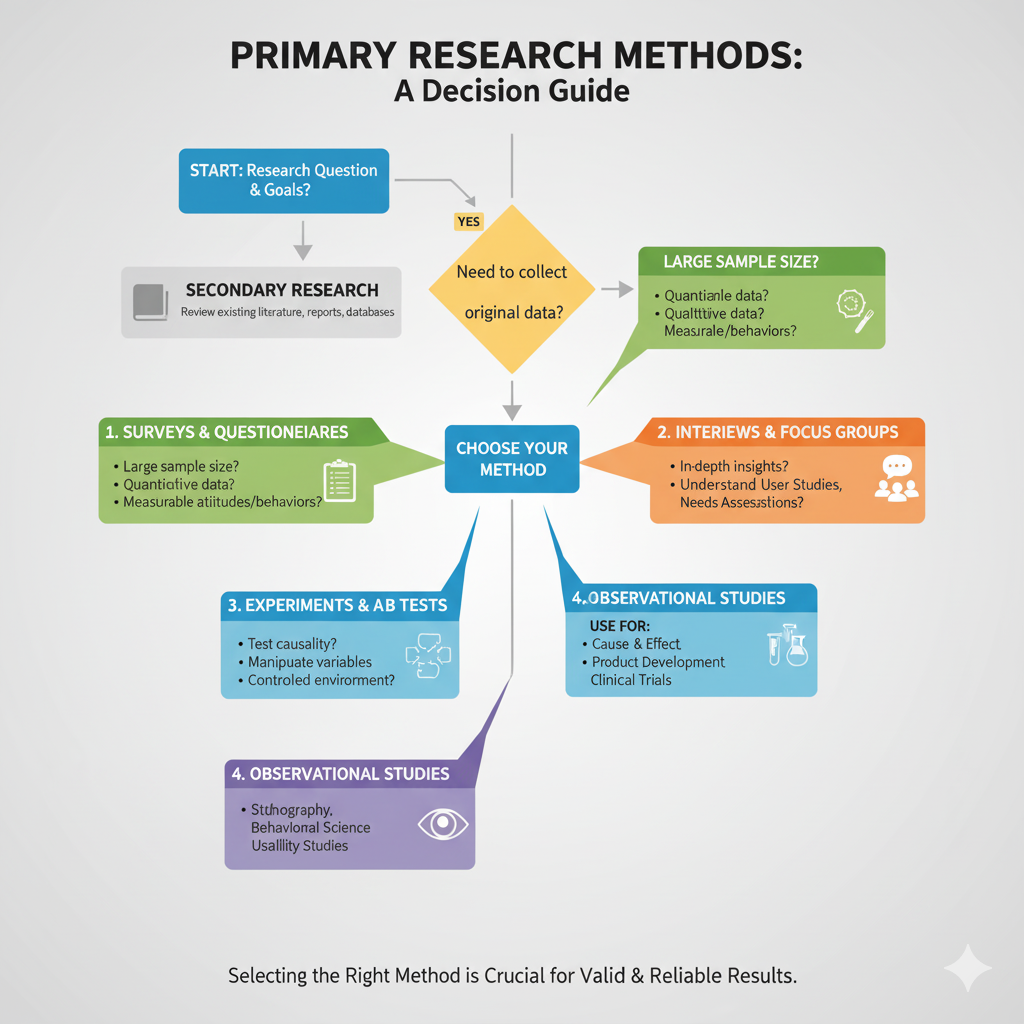
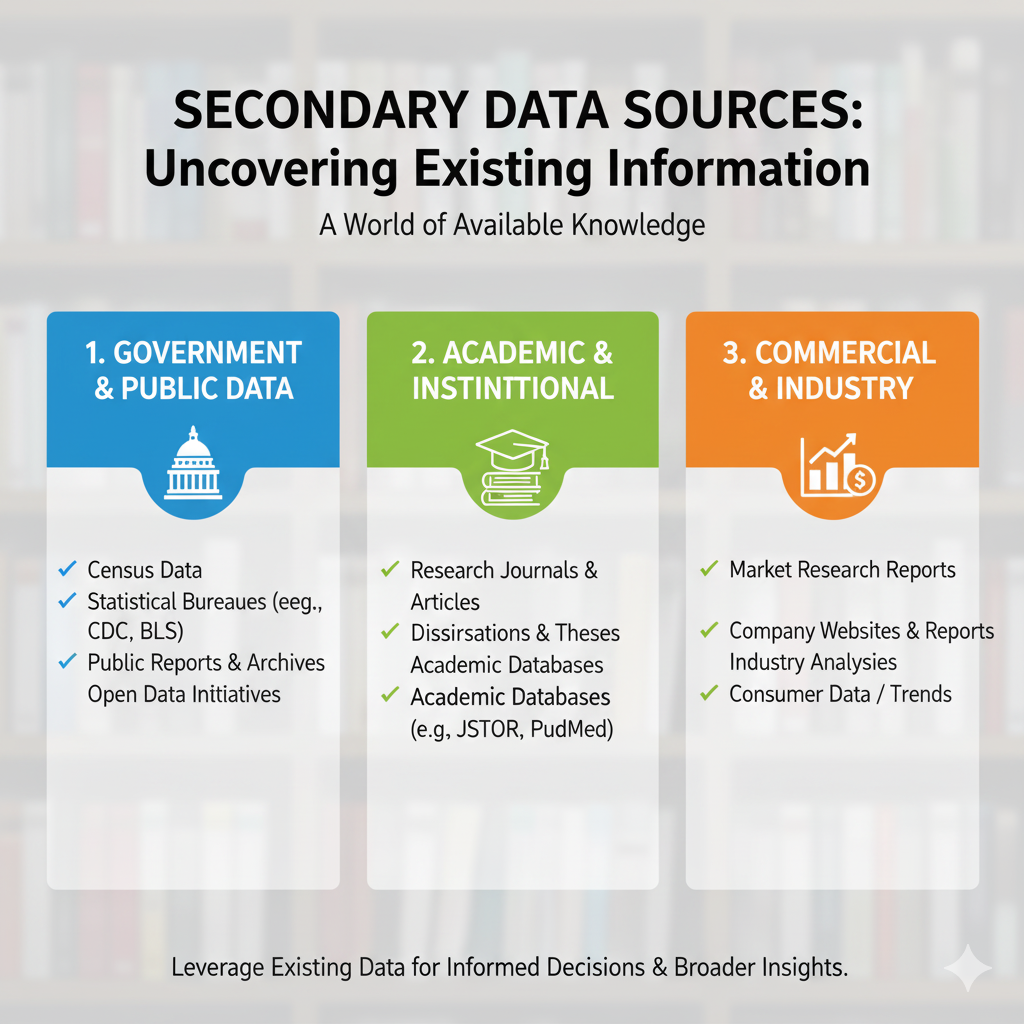
Secondary Quantitative Research Methods
Sometimes, you don’t need to collect new data. Secondary research uses existing information:
- Public data sources: Census data, government statistics, published studies
- Commercial databases: Market research reports, industry analyses
- Internal records: Company sales figures, customer databases
- Academic publications: Journal articles, research papers
This approach saves time and money but limits you to data that already exists.
Data Collection in Quantitative Research
How do researchers actually gather all those numbers? Here are the main techniques:
Sampling Methods
Since studying entire populations is usually impossible, researchers select representative samples:
- Probability sampling: Everyone has a known chance of being selected (random selection)
- Non-probability sampling: Selection based on convenience or specific criteria
Survey Distribution
Researchers can collect data through:
- Online surveys
- Phone interviews
- Paper questionnaires
- In-person interviews
- Mobile apps
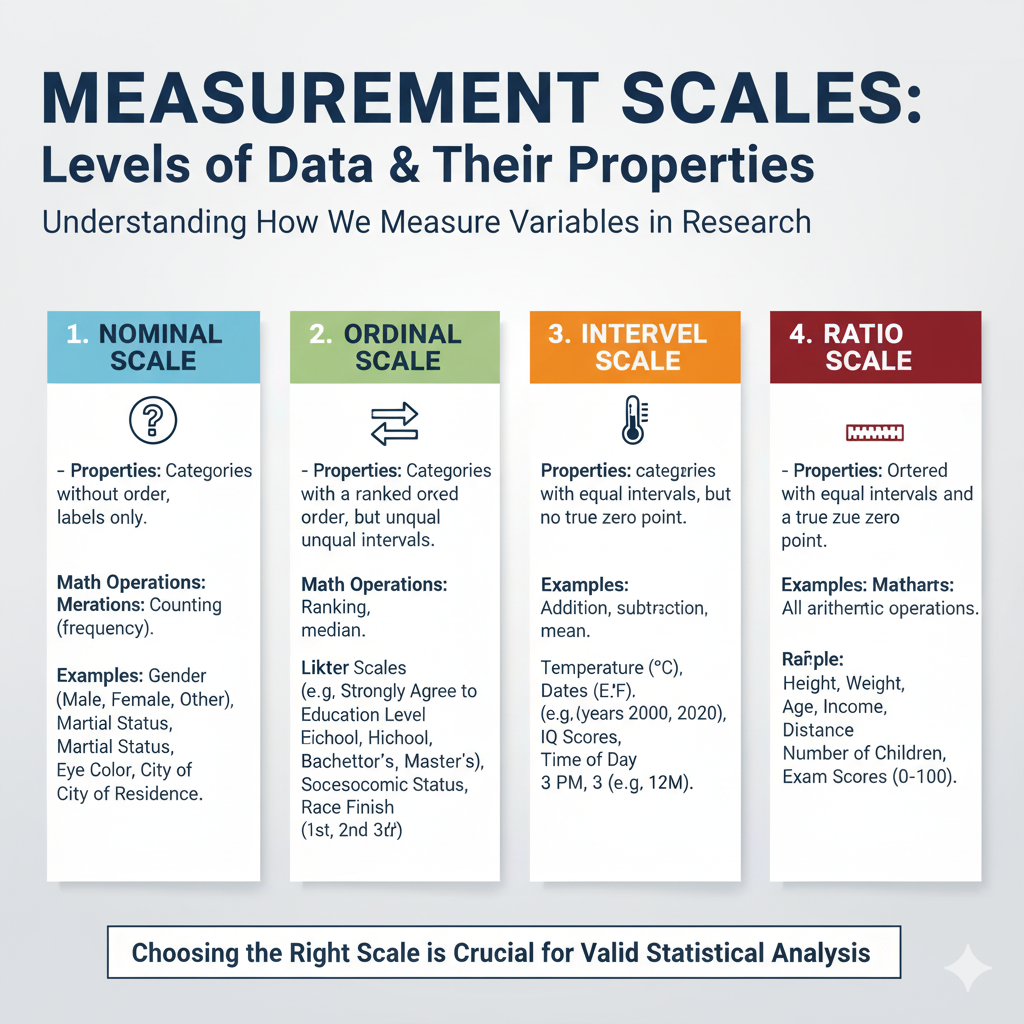
Measurement Scales
Different questions capture different types of data:
- Nominal: Categories with no order (like gender or favorite color)
- Ordinal: Ranked categories (like satisfaction levels)
- Interval: Equal distances between values but no true zero (like temperature)
- Ratio: Equal intervals with a true zero (like height or weight)
The type of data you collect determines which statistical tests you can use later.
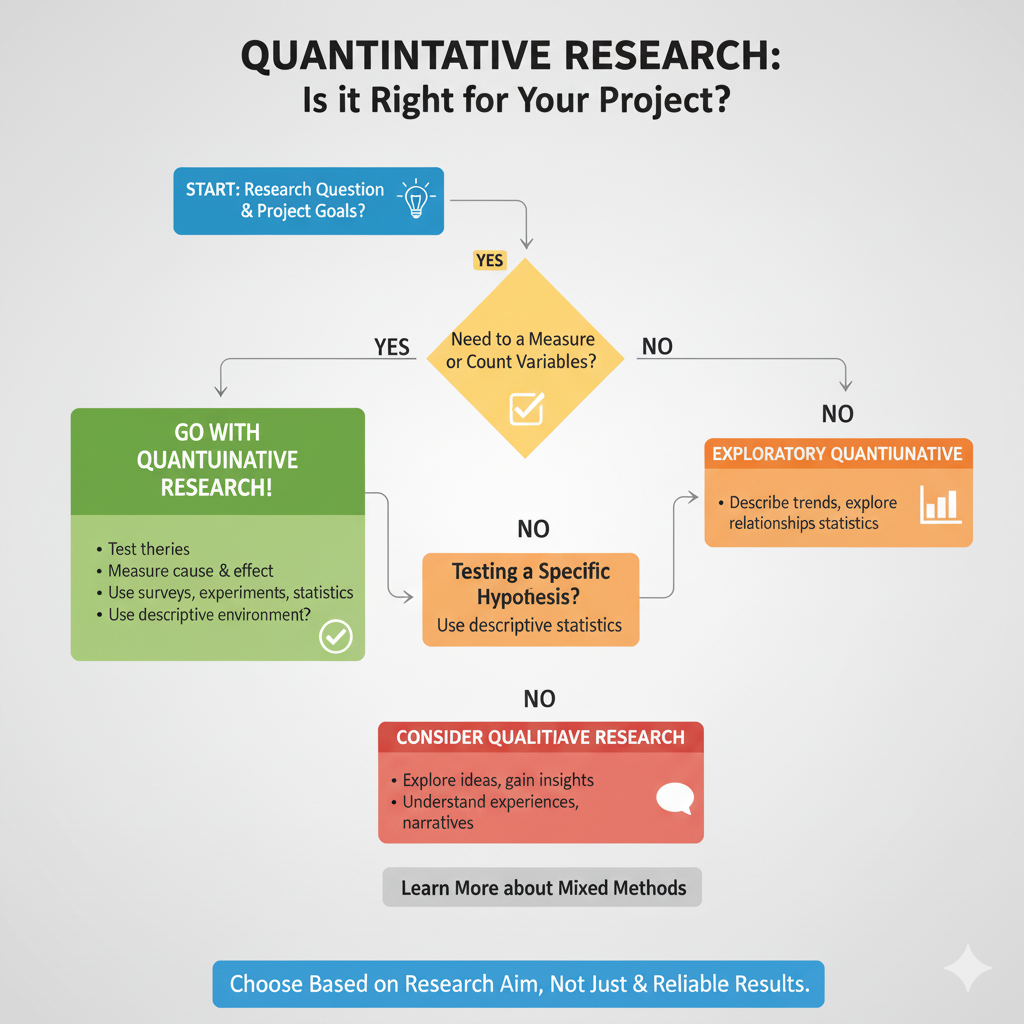
When to Use Quantitative Research
Not sure if quantitative methods are right for your project? Consider using this approach when:
Testing Hypotheses
When you have a specific theory to prove or disprove, quantitative research provides clear evidence through numbers.
Measuring Trends
If you need to track changes over time or identify patterns, numerical data makes this possible.
Making Comparisons
When comparing different groups, products, or methods, quantitative data gives you objective measures for comparison.
Establishing Relationships
To understand connections between different factors (like how price affects sales), quantitative methods reveal correlations and causes.
Generalizing Findings
When you need results that apply to larger populations, properly designed quantitative studies allow for generalization.
A Research Case Study: Website Usability Testing
Let’s see quantitative research in action with a real-world example:
A company wants to improve their website’s user experience. They could:
- Set up a quantitative study: Measure how long it takes 100 users to complete specific tasks on the website
- Collect numerical data: Record completion times, success rates, and satisfaction ratings
- Analyze statistically: Calculate averages and identify where users struggle most
- Draw conclusions: Determine which website elements need redesigning based on the numbers
This approach gives them specific metrics to track improvements after making changes.
Advantages of Quantitative Research
Why choose quantitative methods? Here are the key benefits:
Objectivity and Reliability
Numbers don’t lie (when collected properly). Quantitative research provides hard evidence that’s less influenced by personal bias.
Larger Sample Sizes
You can include more participants, making your findings more representative of the whole population.
Clear Comparisons
Numerical data makes it easy to compare different groups, time periods, or variables.
Statistical Significance
Mathematical tests tell you whether your results happened by chance or represent real patterns.
Replicability
Other researchers can repeat your study using the same methods to verify your findings.
Efficient Analysis
Modern statistical software makes analyzing large datasets faster and easier than ever.
Disadvantages of Quantitative Research
No research method is perfect. Here are some limitations to consider:
Lacks Depth
Numbers tell you what happened but not always why. You might miss the underlying reasons for behaviors.
Limited Context
Standardized questions might miss important nuances or unexpected insights.
Inflexible Design
Once your study begins, it’s difficult to adjust your approach or add new questions.
Potential Sampling Bias
If your sample doesn’t truly represent the population, your results will be skewed.
Resource Intensive
Large-scale quantitative studies can require significant time, money, and expertise.
Oversimplification
Complex human behaviors and attitudes are sometimes reduced to simple numbers.
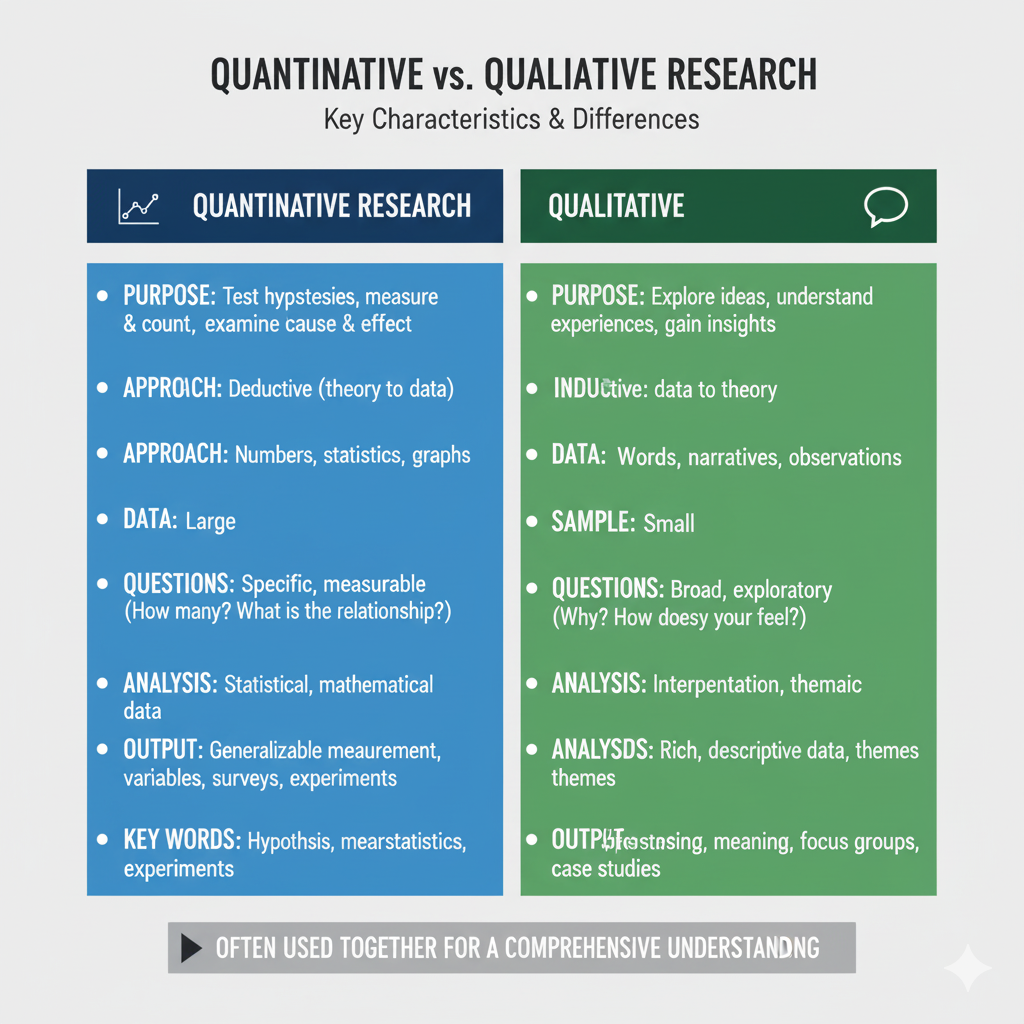
Quantitative vs. Qualitative Research
Still confused about the difference? Here’s a quick comparison:
| Quantitative Research | Qualitative Research |
|---|---|
| Collects numerical data | Collects non-numerical data |
| Uses large samples | Uses smaller samples |
| Structured, predetermined | Flexible, evolving |
| Objective measurements | Subjective observations |
| Statistical analysis | Thematic analysis |
| Tests theories | Builds theories |
| Asks “how many” or “how much” | Asks “why” or “how” |
Many researchers use both approaches together (mixed methods) to get the complete picture.
Best Practices for Conducting Quantitative Research
Want to ensure your research is valid and reliable? Follow these tips:
Start with Clear Objectives
Define exactly what you want to measure before designing your study.
Use Validated Instruments
When possible, use questionnaires or measurement tools that have been tested by other researchers.
Pilot Test Everything
Try your survey or experiment with a small group first to identify and fix problems.
Ensure Representative Sampling
Make sure your participants truly represent the population you’re studying.
Control for Variables
Identify and account for factors that might influence your results.
Analyze Appropriately
Choose statistical tests that match your data type and research questions.
Report Honestly
Present all findings, not just those that support your hypothesis.
Consider Ethics
Protect participants’ privacy and get proper consent before collecting data.
Types of Data Analysis in Quantitative Research
Once you’ve collected all that data, what do you do with it? Here are common analysis methods:
Descriptive Statistics
Summarizes your data through measures like:
- Mean (average)
- Median (middle value)
- Mode (most common value)
- Range (spread of values)
- Standard deviation (how dispersed the data is)
Inferential Statistics
Helps you draw conclusions beyond your immediate data through:
- Hypothesis testing
- Confidence intervals
- Regression analysis
- ANOVA (Analysis of Variance)
- Chi-square tests
Data Visualization
Makes patterns easier to see through:
- Bar charts
- Line graphs
- Scatter plots
- Pie charts
- Heat maps
The right analysis depends on your research questions and data types.
Real-World Examples of Quantitative Research
Let’s look at how quantitative research works in different fields:
Business Example
A retail company surveys 5,000 customers about their shopping preferences, analyzes the data, and discovers that 78% of customers under 30 prefer mobile checkout options.
Education Example
Researchers compare test scores between students who received traditional instruction versus interactive learning, finding that the interactive group scored 15% higher on average.
Healthcare Example
A clinical trial tracks blood pressure measurements in 500 patients taking a new medication versus a placebo group, showing a statistically significant reduction in the treatment group.
Social Science Example
A study measures income levels across different geographic regions, revealing correlations between location and economic opportunity.
These examples show how quantitative methods provide concrete evidence for decision-making across industries.
Frequently Asked Questions
What’s the difference between correlation and causation?
Correlation means two variables change together (like ice cream sales and temperature). Causation means one variable directly causes the other to change. Quantitative research can easily show correlation, but establishing causation requires careful experimental design.
How large should my sample size be?
It depends on your population size, desired confidence level, and margin of error. Generally, larger samples give more reliable results. Statistical calculators can help determine the right size for your study.
Can quantitative and qualitative methods be combined?
Absolutely! This is called mixed methods research. You might use surveys (quantitative) to identify broad patterns, then interviews (qualitative) to understand the reasons behind those patterns.
What software is used for quantitative data analysis?
Popular options include SPSS, R, SAS, Excel, and specialized survey platforms like SurveyMonkey or Qualtrics that include built-in analysis tools.
How do I know if my results are statistically significant?
Statistical significance means your results are unlikely to have occurred by random chance. It’s typically indicated by a p-value less than 0.05, though standards vary by field.
Key Takeaways
Quantitative research gives you the power to make decisions based on solid numerical evidence. Remember these important points:
- Quantitative research collects and analyzes numerical data to find patterns and test hypotheses
- Common methods include surveys, experiments, and analyzing existing datasets
- Choose quantitative approaches when you need objective measurements, comparisons, or generalizable results
- Ensure validity through proper sampling, controlled variables, and appropriate statistical analysis
- Consider combining quantitative methods with qualitative approaches for deeper insights
Whether you’re a student designing your first research project or a professional making data-driven decisions, quantitative methods provide the objective evidence you need to move forward with confidence.
By understanding when and how to use quantitative research, you’ll ask better questions and find more reliable answers to guide your decisions.